
Measurement first, opinions second.
The same sequence runs every night at 04:10. The order is not a style choice. Run step two before step one and the answers are wrong in a way nobody notices.
Check the instruments
Is the analytics tag still on the page? Has the tracking number been swapped? Did someone push a release that set the site to noindex? Is a consent banner blocking collection?
A removed analytics tag looks exactly like a traffic collapse. Interpreting one as the other is how a business gets told to panic about a problem it does not have. Nothing downstream is allowed to form an opinion until this passes.
Measure
Crawl the site. Run a real headless browser against it for Core Web Vitals. Pull Search Console, Business Profile, Bing, ads, reviews and rank data.
A crawler sees structure. It cannot see that the page takes sixteen seconds to paint on a phone, which is the thing a customer actually experiences. Both get measured, and they disagree more often than you would expect.
Compare fairly
Twenty-eight days rolling, with holidays, severe weather, promotions, known outages, site releases and seasonal transitions flagged on the periods they affect.
Without context flags the agent announces that traffic collapsed thirty percent, having compared Thanksgiving to a normal Thursday. The flags are what make a comparison mean anything.
Decide whether it matters
Did something change? Is measurement intact? Is the change outside the normal range? Does it matter for this particular business?
Most nights the honest answer is that nothing meaningful happened, and that is a valid and frequent outcome. An agent that emails every day is in spam within a month, and then the one message that mattered goes with it.
Recompute, or withhold
Only measured evidence may move the score. Components with no data are excluded and their weight redistributed. Below the confidence floor, no number publishes at all.
Scoring an unmeasured component as zero would invent a bad result out of an absence. Publishing a score built from a fraction of the weight would be precision the data cannot support.
What you get on Monday.
One short report. The things that moved, what moved them, and the questions it still cannot answer along with the specific connection that would fix each.
How a claim gets approved for sending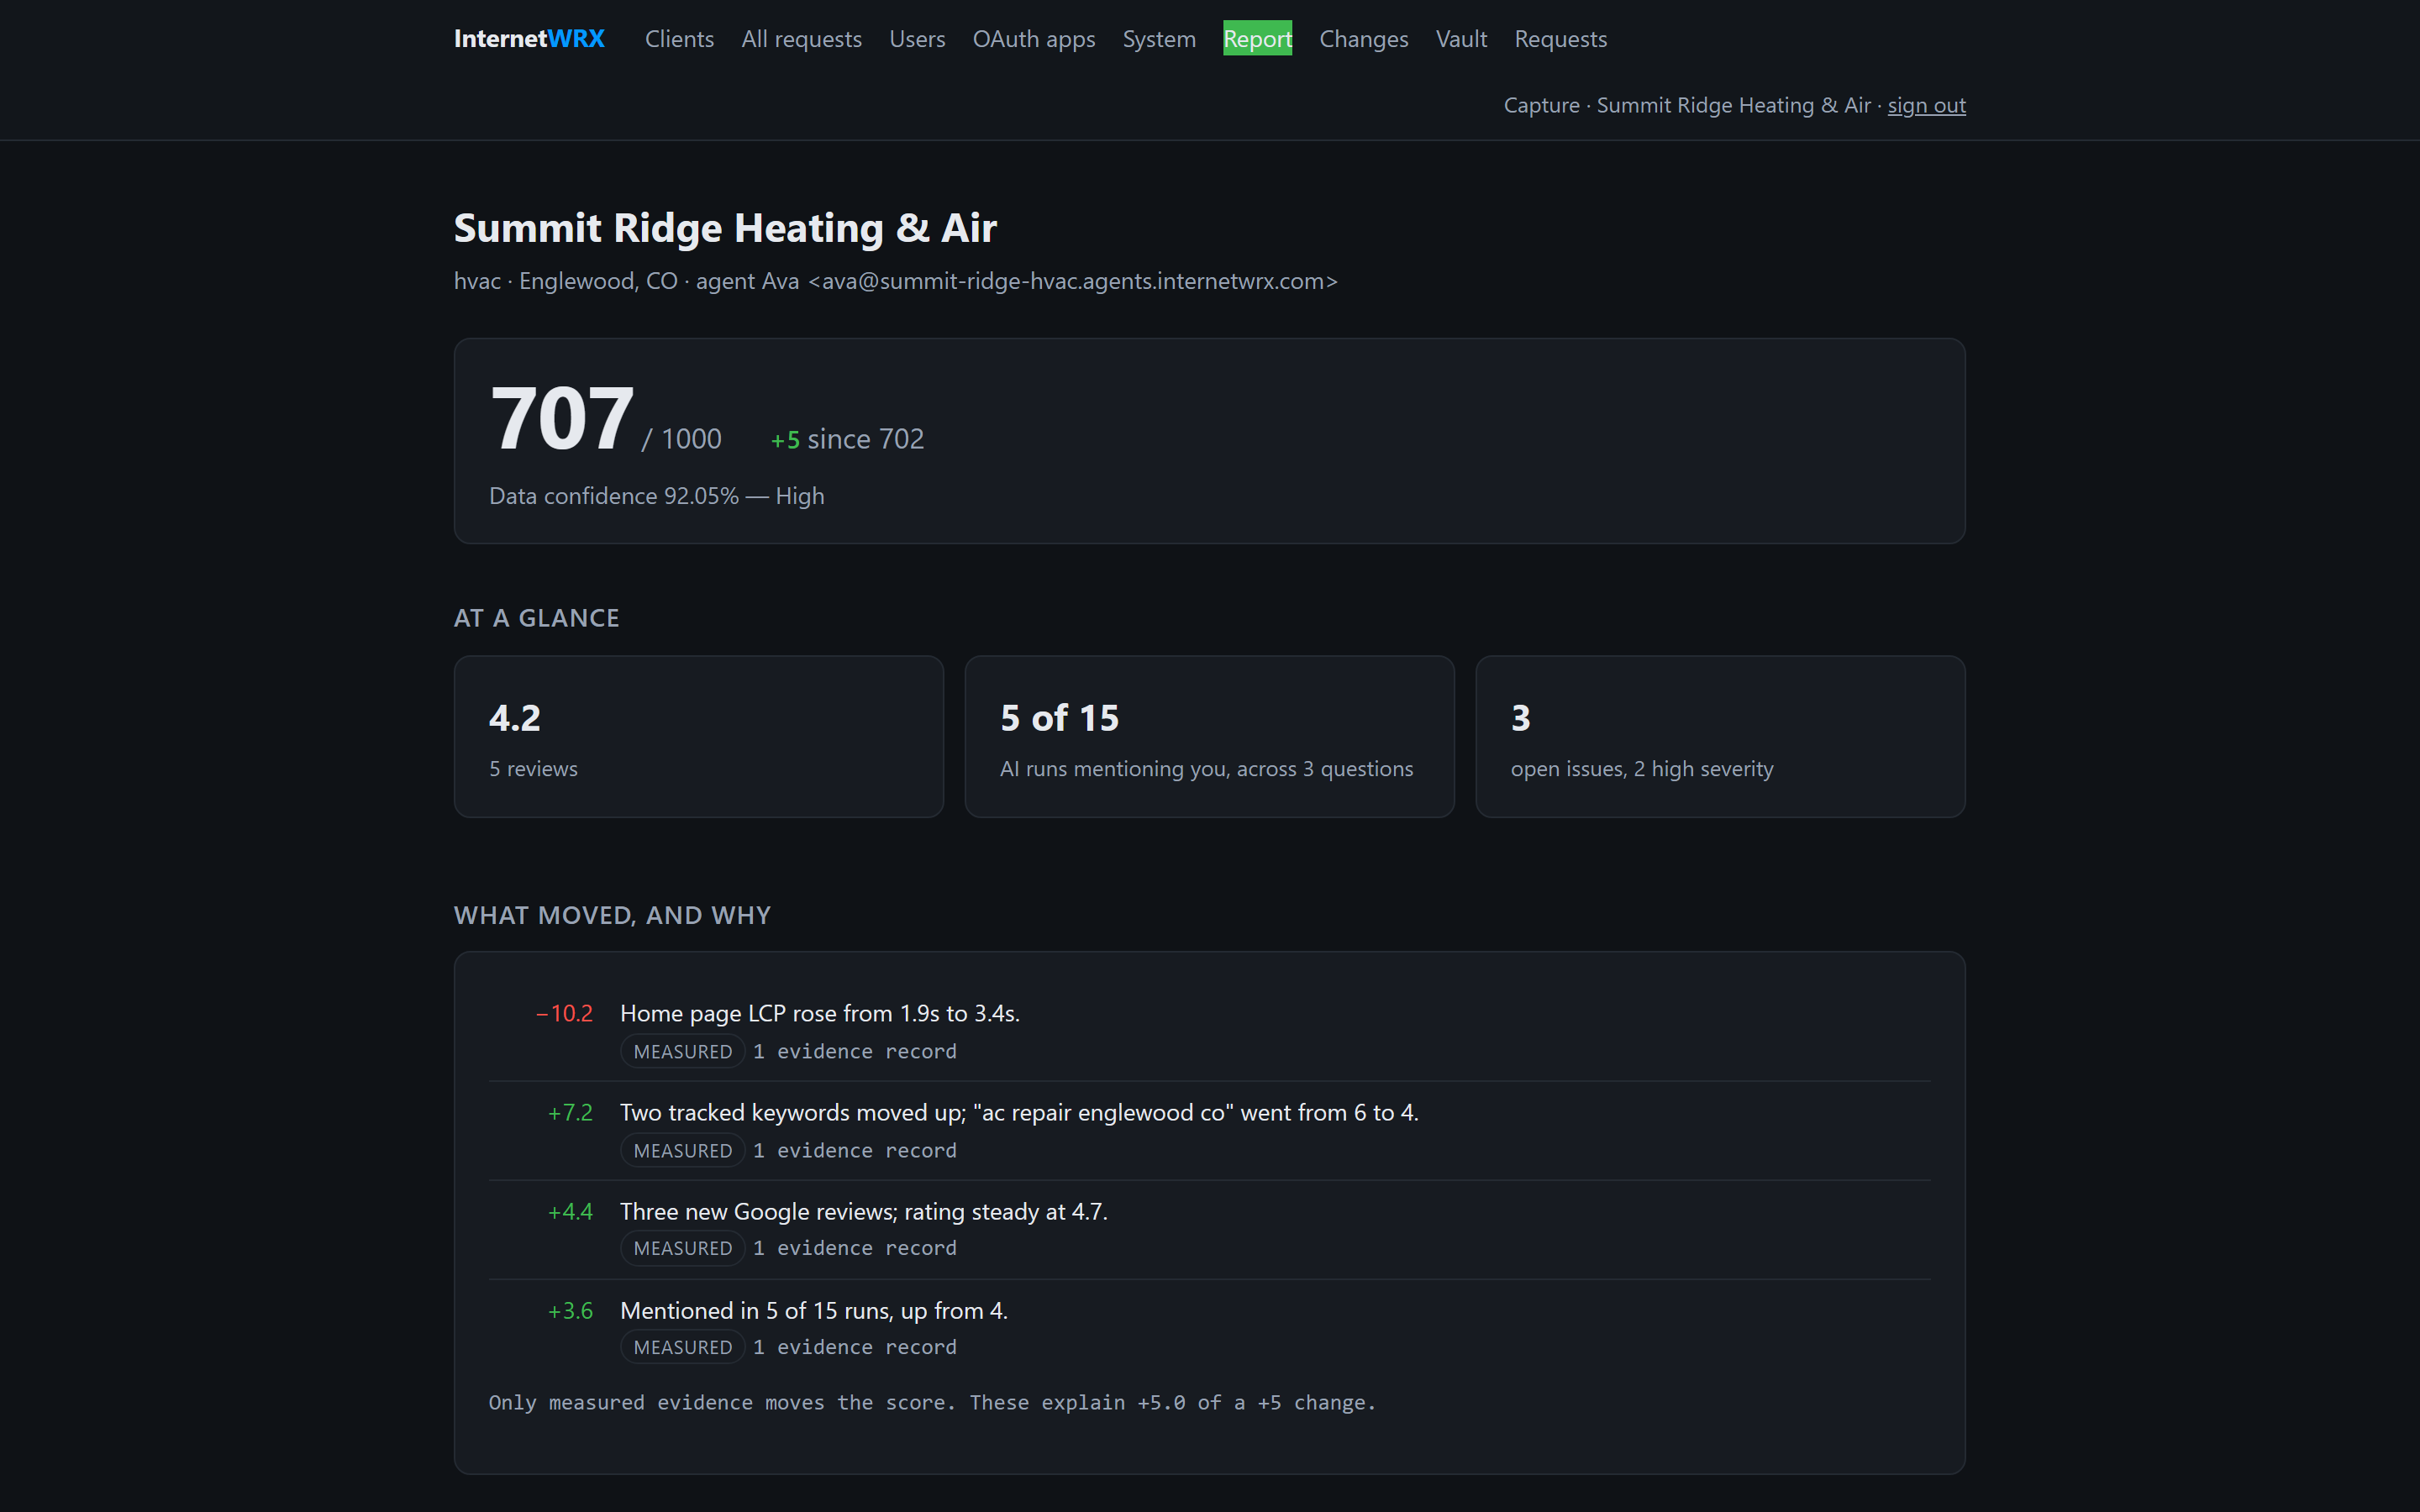
The loop that makes it compound.
Most tools stop at the recommendation. The last three steps are the ones that turn advice into something that can be checked, and eventually into something that knows its own hit rate.
- 01Observe
- Pull every source that will talk to us, and crawl the ones that will not.
- 02Prove
- Write each finding as a record with a source, a timestamp and a freshness rule.
- 03Explain
- Say what changed and what it is attached to, without saying one caused the other.
- 04Recommend
- Rank what to do by what it is worth against what it costs to do.
- 05Authorize
- A person approves anything that touches a live site, through a single-use link.
- 06Act
- Execute, holding the previous value so the change can be undone.
- 07Verify
- Re-fetch to confirm the change published. That is a different question from whether it worked.
- 08Measure
- Weeks later, check the outcome against a comparable window.
- 09Learn
- Feed the result back, so the next estimate is based on what happened rather than on a guess.
Nothing is changed without a person saying so.
Every action carries scored attributes: whether it can be undone, whether it is public facing, whether it costs money, and how much search risk it carries. Financial actions never run automatically at any level of trust, and an override cannot buy past that.
19
Action types, each with scored risk attributes
0
Financial actions that can run unattended
2
Separate proofs: it published, and it worked